")
")
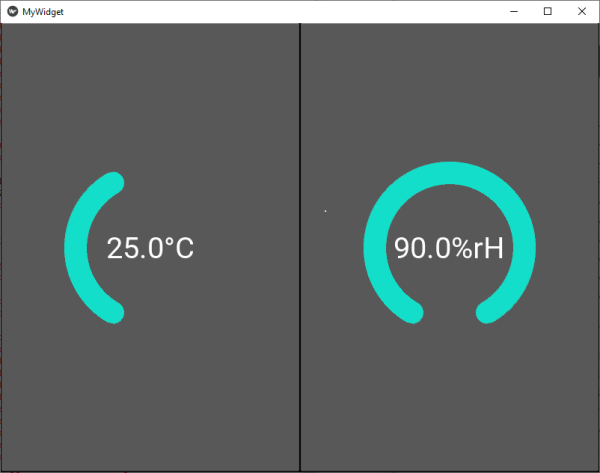
The widget we are building here will show two scales centered around the numeric value which is represented by the scales. The scales will update automatically as soon as new values are available. Some customization of the appearance will also be possible.
Where is my data?
The widget reads data from a json file with the simple name data.json. The data format is shown here:
{"time_code": "Thu Dec 20 20:18:46 2018", "temperature": 25.0, "humidity": 65.0}You can simply create this file with the data shown or if you want to use an actual temperature and humidity sensor can you check this article.
The KV file
If you run the script standalone we want to return a test widget. Therefore is the first part of the file a BoxLayout showint the widget.
The widget itself is derived from a BoxLayout as well. That has the advantage that ist automatically expands over the whole available screen. If you want to derive it from another base class do you have to take care of the sizing by configuring the hint values.
the Widget MyFirstWidget itself contains two buttons. A text showing the measured value plus a unit is surrounded by a circular scale made from a line which represents the value as well.
Good to know:
- By definition the starting point of the linie is at the 12 o'clock position. I want the line to start the line at -150° and go to a max. of +150°.
- You can have a straight end of the line if you set the parameter cap: 'none' or a rounded end if you set cap: 'round'
- The line can have any color you want. The color is set by the rgba value
- Use a Color Picker to get the value you want. Most pickers will return a value from 0-255. But the rgba needs a decimal from 0-1 so don't forget to divide by 255.
<MyRootLayout>:
    orientation: 'vertical'
    on_touch_down: self.ids.myfirstwidget.show_data('data.json')
    MyFirstWidget:
        id: myfirstwidget


<MyFirstWidget>:
    Button:
        id: btn1
        text: root.val1 + root.unit1
        font_size: 40
        canvas:
            Color:
                rgba: 0.14,0.8,0.9,0.9
            Line:
                circle:(self.center_x, self.center_y, 100, -150, root.num1)
                width: 15
                cap: 'none'
    Button:
        id: btn2
        text: root.val2 + root.unit2
        font_size: 40
        canvas:
            Color:
                rgba: 0.14,0.8,0.9,0.9
            Line:
                circle:(self.center_x, self.center_y, 100, -150, root.num2)
                width: 15
                cap: 'none'
The Python file
Our widget will need a couple of properties. these properties are supposed to update themselves in the visualization as soon a s the value in the script changes. This behavior is supported by the Kivy properties. By e.g. name binding can you bind a value in your python script to a value in the kv file. The implemented Observer Pattern will take care of the updating.
The script is goint to use NumericProperty and StringProperty. The kv file defines the following vaiables which have to be updated automatically.
num1: First scale arc in ° (int)
num2: Second scale arc in ° (int)
val1: Value of first measurement (string)
val2: Value of second measurement (string)
unit1: Unit of first measurement (string)
unit2: Unit of second measurement (string)
Take car of the data types and implement eventual conversions to avoid crashes of you program.
The function show_data() will read the measurement values from the json file. To scale the values from 0-300° do we use the function fit_to_scale().
from kivy.app import App
from kivy.uix.boxlayout import BoxLayout
from kivy.uix.button import Button
from kivy.properties import NumericProperty, ObjectProperty, StringProperty
import json


class MyFirstWidget(BoxLayout):
    num1 = NumericProperty(150)
    num2 = NumericProperty(150)
    val1 = StringProperty('--')
    val2 = StringProperty('--')
    val3 = StringProperty('--')
    unit1= StringProperty('°C')
    unit2= StringProperty('%rH')

    def show_data(self, filename):
        '''opens a json file and reads temperature and humidity'''
        with open(filename, 'r') as read_file:
            data=json.load(read_file)
            self.val1 = str(data['temperature'])
            self.val2 = str(data['humidity'])
            self.val3 = data['time_code']
            self.num1 = self.fit_to_scale(data['temperature'], 15, 40)
            self.num2 = self.fit_to_scale(data['humidity'], 20, 90)

    def fit_to_scale(self, value, minimum, maximum):
        ''' scales the given value between the set max and min limits'''
        return ((value - minimum) / (maximum - minimum) * 300) - 150

class MyRootLayout(BoxLayout):
    pass

class MyWidgetApp(App):
    def build(self):
        return MyRootLayout()

if __name__ == '__main__':
    MyWidgetApp().run()
Result
On startup will you see the raw widget with the default values for our properties.

As soon as you click anywhere on the screen is the on_touch_down Event fired and the function show_data() executes. As planned are the properties updated in the script and automatically in the visualization as well.

This here is an example with a different rgba value an rounded ends.

Quelle
More information about lines and their properties can be found here
If you want more information about binding in Kivy look it up here.
Source code on GitHub
https://github.com/HaikoKrais/TwoScalesWidget