")
")
Many applications for the Raspberry Pi include the measurement and visualization of data. This series of articles shows you how to realize that.
We will start with creating some hardware. A desktop stand for the pi with touch display as well as a sensor HAT to measure temperature and humidity.
After we took care of the hardware ist it goint into coding. You will learn how to install Kivy, create a framework for the visualization and finally we are going to write a couple of apps. They will be using the data from our sensor HAT to display temperature and humidity in a romm as well as we are going to write a weathe app using the API from OpenWeatherMap. An App showing the Pollen load in your area as well as a simple app to inform you about the state of the Covid pandemic.
Contents
These links will directly redirect you to the respective articles. Or you read your way through the whole story.
- Hardware for the project
- Desktop stand for the Raspberry Pi with Touch Screen
- Capture Data
- Create the framework
- Show Temperature and Humidity
- Add a Menu
- Integrate the Weather Forecast
- Integrate a Pollen App
- Source Code on GitHub

Hardware for the project
There is only few hardware to purchase I am using:
- Raspberry Pi 3B +
- Raspberry Pi power supply
- The official Raspberry Pi 7" Touch Display
- DHT 11 Temperature and Humidity Sensor
- Bread Board or circuit board
- 2kOhm resistor
- Wires
If you plan to run headless or do already have a disply you can go on with the sensor HAT. If you want to place your Rasperry Pi on a desk take a look on the simple stand below.
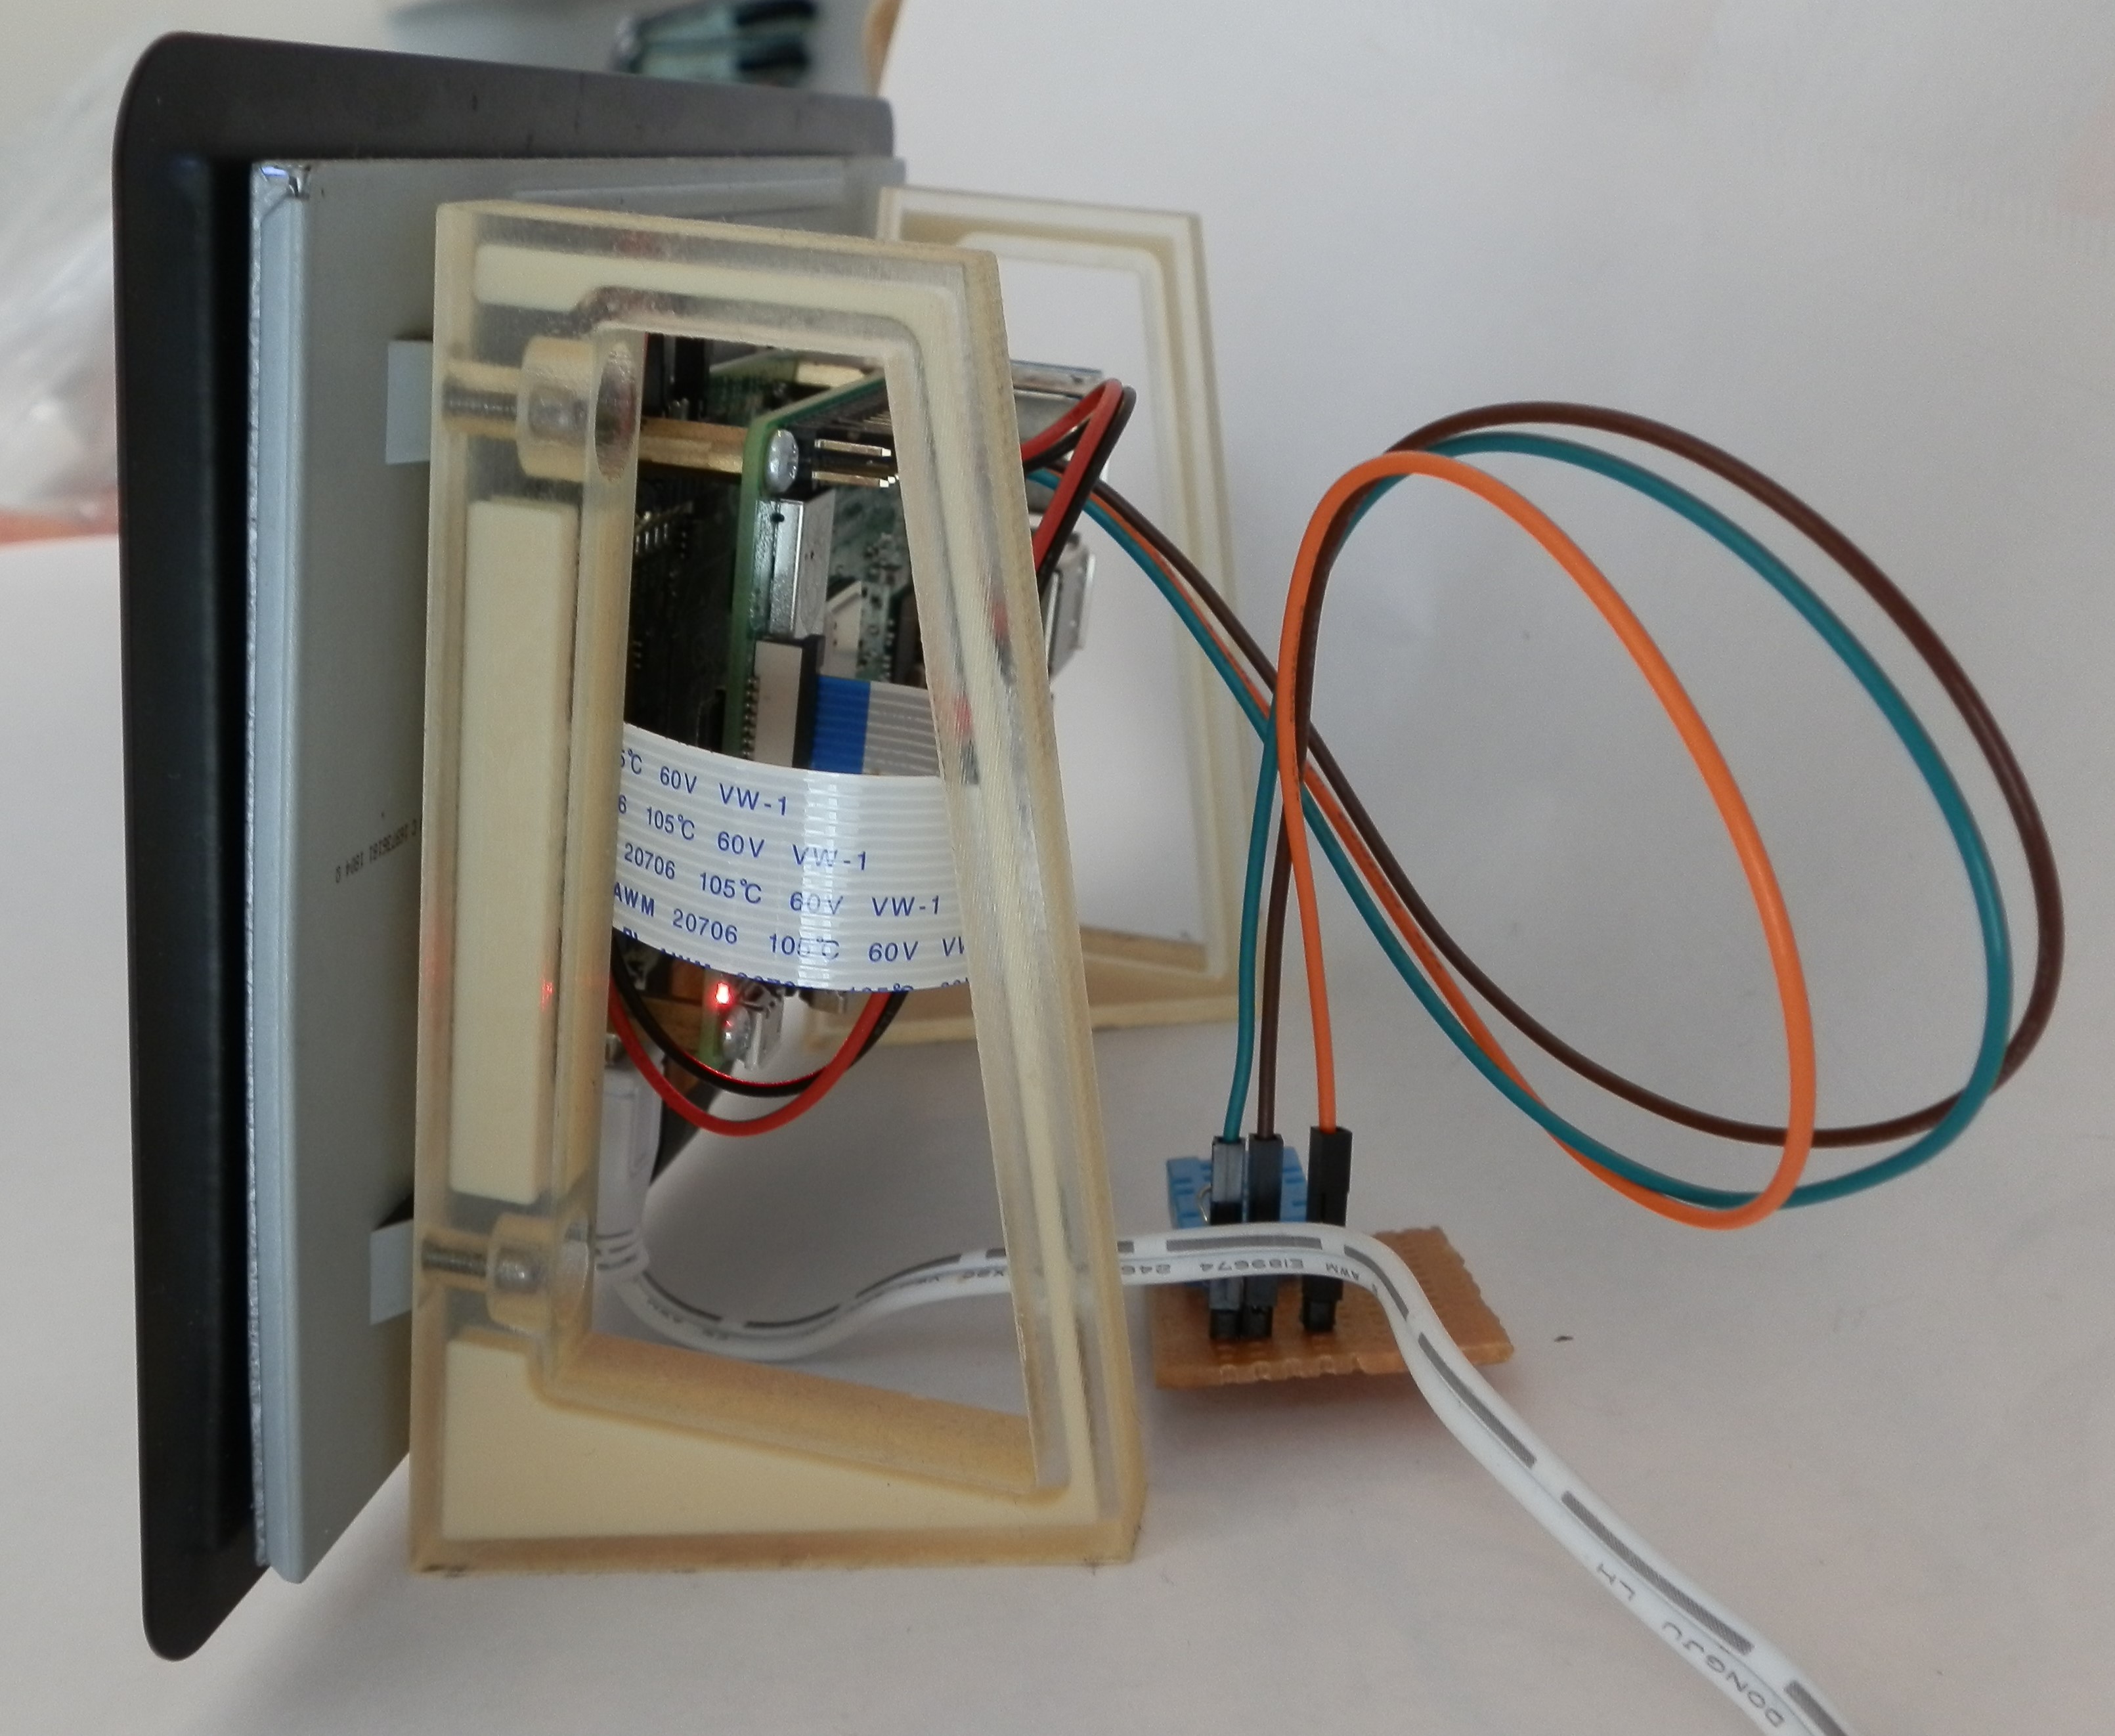
Desktop stand for the Raspberry Pi with Touch Screen
The stand is made of two 3D printed holders which easily connect to the pre-existing threads of the display. They leave the Raspberry Pi quite open and heat generated by it will be removed by free convection and you will not need any additional cooling or fans. The pins are also easy to access in case you want to add other hardware. You can download the CAD data of the stands here (*)
(*) I will be rewarded a little amount when you download the CAD data
Capture Data
Data of temperature and humidity will be captured with a DHT 11.
Measure Temperature and Hunidity with DHT 11
The data is then passed on to a database for later analysis and as well in a JSON file. The JSO file is the basis for the visualization.
Write Temperature and Humidity to Database and JSON file
The next steps will take this data an create a simple visualization with it that can be expanded as needed.
Visualize data
Create the framework
The visualization is made from pure Pyhton code. And Kivy will be the GUI of choice. For starters let's go ahead and create a basic framework which provides navigation in our visualization between the main screen and the different apps / widgets we are going to create
Create Kivy Framework for Visualization
Show Temperature and Humidity
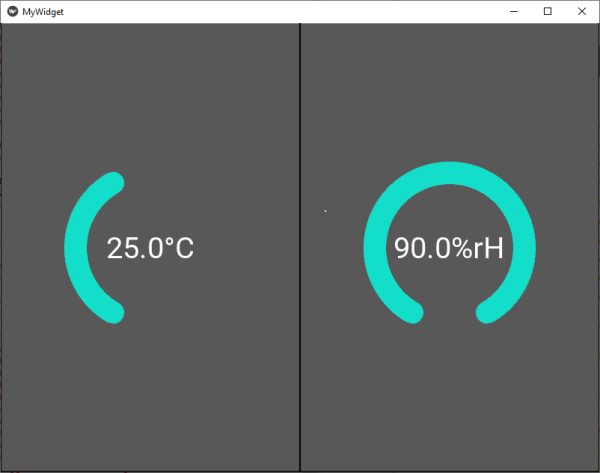
Now that the framework is running, we fill it up with the first widget which can simply show two measurement values with a little scale and a simple plot.
Kivy Matplotlib Widget with two plots and shared x-axis
Integrate the widget / app into the framework
After understanding the widget is now the time to integrate it in the framework
The necessary steps are quite simple:
- add the following lines in the kv file of the framework
- Screen2 defines the layout for the app. It positions the buttons for navigation and the size of the integrated widget
- The text of lable lbl2 is going to show the time_code of the measurements which indicates if the values are up to date
#Screen 2 displays the temperature and humidity
<Scrn2>:
name: 'scrn2'
Button:
id: back
text: 'Hauptmenu'
on_press:
root.manager.transition.direction = 'right'
root.manager.goto_scrn1()
size_hint: .1, .1
pos_hint: {'top':1, 'left':1}
Label:
id: lbl1
text: 'Wohnzimmer'
size_hint: .8, .1
pos_hint: {'top':1, 'center_x':.5}
Label:
id: lbl2
text: 'Zeitstempel: ' + root.ids.widget1.val3
size_hint: 1, .1
pos_hint: {'bottom':1, 'center_x':.5}
ScrollView:
id: scroll1
size_hint: 1, .85
pos_hint: {'top': .85, 'left':1}
GridLayout:
id: grid1
size_hint: 1, None
height: self.minimum_height
cols: 1
row_force_default: True
row_default_height: root.height * 0.85
TwoScalesWidget:
id: widget1
size_hint: 1, .8
pos_hint: {'top':.9, 'left': 1}
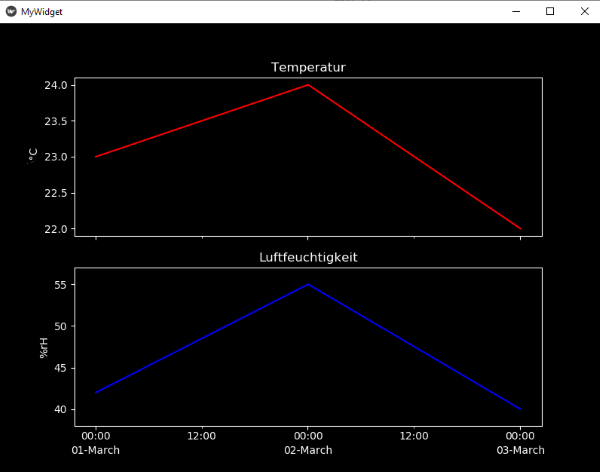
TwoPlotsSharedXWidget:
id: widget2
units : ['°C','%rH']
titles : ['Temperatur','Luftfeuchtigkeit']
ax_colors : ['r','b']
sourceX: root.timestamp
sourceY: [root.temperature, root.humidity]
formatter: '%d-%B'
size_hint: 1, .8
pos_hint: {'top':.9, 'left': 1}- The measurements are going to vary from time to time. Thats why we need to update our widget frequently. Which means that we have to call the show_data function regularly. This is done by using the Kivy clock functionality. We can simply modify the __init__ funtion and add the necessary clock.schedule calls. We have the regular calls and one single call once the widget is initialized to show something right at the start up of the app.
from kivy.clock import Clockclass Scrn2(Screen):
'''
Shows the screen containing the temperature and humidity widget
Attributes:
None
'''
timestamp = ListProperty([])
temperature = ListProperty([])
humidity = ListProperty([])
def __init__(self, **kwargs):
'''
Start updating the screen regularly.
A clock will call the update function in a selectable interval.
Put all functions you want to update into the update function
Args:
**kwargs (): not used. For further development.
Returns:
Nothing.
'''
super(Scrn2, self).__init__(**kwargs)
Clock.schedule_interval(self.update_scales, 60)
Clock.schedule_once(self.update_scales)
Clock.schedule_interval(self.update_graph, 60)
Clock.schedule_once(self.update_graph)
def update_scales(self, dt):
'''
updates the scales
Args:
dt (int): interval in seconds in which the funtion will be called
Returns:
nothing
'''
low1 = float(App.get_running_app().config.get('Two Scales Widget', 'temp_lower_limit'))
high1 = float(App.get_running_app().config.get('Two Scales Widget', 'temp_upper_limit'))
low2 = float(App.get_running_app().config.get('Two Scales Widget', 'humidity_lower_limit'))
high2 = float(App.get_running_app().config.get('Two Scales Widget', 'humidity_upper_limit'))
filename = App.get_running_app().config.get('Two Scales Widget', 'data_source_scales')
self.ids.widget1.show_data(filename=filename, low1=low1, high1=high1, low2=low2, high2=high2)
def update_graph(self, dt):
'''
updates the plot
Args:
dt (int): interval in seconds in which the funtion will be called
Returns:
nothing
'''
# Read the data to show from a file and store it
filename = App.get_running_app().config.get('Two Scales Widget', 'data_source_graph')
try:
with open(filename, 'r') as read_file:
data = json.load(read_file)
print(data)
except FileNotFoundError:
print('File not found for temperature and humidity graph')
return
self.timestamp.clear()
self.temperature.clear()
self.humidity.clear()
for item in data:
self.timestamp.append(datetime.fromtimestamp(mktime(strptime(item['time_code'], '%Y-%m-%d %H:%M:%S'))))
self.temperature.append(float(item['temperature']))
self.humidity.append(float(item['humidity']))
self.ids.widget2.update_plot()Executing the code and navigating to the living room will show us the scales for temperature and humidity as well as the plot for the last two days once we start scrolling down.
Add a Menu
If you have been reading the code carefully you might have found that a couple of values like the limits of the scales were not coded directly but came from a call looking somewhat like this here:
App.get_running_app().config.get('Two Scales Widget', 'temp_lower_limit')This call accesses values which are defined in a menu. They will allow your user to customize their App by adjusting limits for their feel good temperature or by localizing their city of residence.
A general introduction into Kivy menus is described in this article. Menü für Einstellungen in Kivy erstellen
First we need an .ini file and a couple of .json files to define the menu. In my case the files are directly in the directory of the app.

mysettings.ini
[Weather Widget]
city = Berlin,de

[Two Scales Widget]
temp_upper_limit = 40
temp_lower_limit = 15
humidity_upper_limit = 90
humidity_lower_limit = 20
settings_two_scales_widget.json
[
    {
        "type": "numeric",
        "title": "Temperatur Obergrenze",
        "desc": "Obergrenze für Temperatur",
        "section": "Two Scales Widget",
        "key": "temp_upper_limit"
    },
    {
        "type": "numeric",
        "title": "Temperatur Untergrenze",
        "desc": "Untergrenze für Temperatur",
        "section": "Two Scales Widget",
        "key": "temp_lower_limit"
    },
    {
        "type": "numeric",
        "title": "Feuchtigkeit Obergrenze",
        "desc": "Obergrenze für Feuchtigkeit",
        "section": "Two Scales Widget",
        "key": "humidity_upper_limit"
    },
    {
        "type": "numeric",
        "title": "Feuchtigkeit Untergrenze",
        "desc": "Untergrenze für Feuchtigkeit",
        "section": "Two Scales Widget",
        "key": "humidity_lower_limit"
    }
]
settings_weather_widget.json
[
    {
        "type": "string",
        "title": "Stadt",
        "desc": "Vorhersage für Stadt:",
        "section": "Weather Widget",
        "key": "city"
    }
]
Modifications in the .kv file
The .kv file needs to be modified to enable access to the screen classes from the widgets of the app.

Modifications in the .py file
To start with let's include the necessary modules.

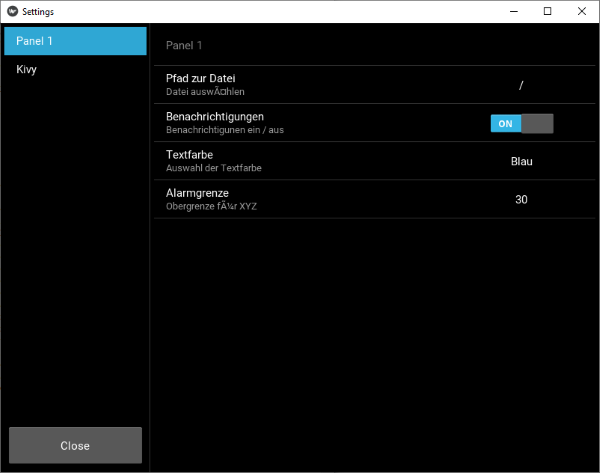
Finally the menu has to be added in the MyVisuApp class. We need to overload the function build() which is goint to read the mysettings.ini file which is going to set the general structure of the menu. By overloading the build_settings() function is the structure filled with life by adding the elements for our inputs.
Since I want to update my widgets dynamically after a change in the menu and not only after a restart is it necessary to overload the on_config_change() function. Here is all the behavior defined that is necessary to update the widgets.
class MyVisuApp(App):
    def build(self):
        '''
        overwrites the build() function.
        The appearance of the settings is set here.
        Choose from the available layouts: https://kivy.org/doc/stable/api-kivy.uix.settings.html#different-panel-layouts
        The preset values for the settings are loaded by the config.read() function
        Args:
            None
        Returns:
            class MyScreens().
        '''

        self.settings_cls = SettingsWithSidebar

        fileDir = os.path.dirname(os.path.abspath(__file__))
        absFilename = os.path.join(fileDir, 'mysettings.ini')
        self.config.read(absFilename)
        return MyScreens()

    def build_settings(self, settings):
        '''
        overwrites the build_settings() function.
        Add all necessary panels here by loading from the corresponding file.
        Args:
            settings
        Returns:
            Nothing.
        '''

        fileDir = os.path.dirname(os.path.abspath(__file__))
        absFilename1 = os.path.join(fileDir, 'settings_weather_widget.json')
        absFilename2 = os.path.join(fileDir, 'settings_two_scales_widget.json')
        settings.add_json_panel('Weather Widget', self.config, absFilename1)
        settings.add_json_panel('Two Scales Widget', self.config, absFilename2)

    def on_config_change(self, config, section, key, value):
        '''
        overwrites the on_config_change() function.
        define actions that shall happen when specific entries in the configuration change here.
        Args:
            config (kivy.config.ConfigParser):
                current configuration.
            section (str):
                name of the section where the key belongs to.
            key (str):
                key as specified in the json panels.
            value ():
                value of the key. return value depending on the type of variable.
The result should look somewhat like this here, once you enter the menu.
Integrate the Weather Forecast
For the weather forecast are we going to create a widghet which is based on the OpenWeaterMap API. The widget can be recycled in your apps or run as a standalone version. The article will guide you through the creation of the widget.
Weather App in Kivy Python with OpenWeatherMap API
After the widget works are we going to add it just the same way as we did with the temperature and humidity widget.
- Add the lines for Screen 3 in the .kv file
#Screen 3 displays the weather forecast
<Scrn3>:
name: 'scrn3'
Button:
id: back
text: 'Hauptmenu'
on_press:
root.manager.transition.direction = 'right'
root.manager.goto_scrn1()
size_hint: .1, .1
pos_hint: {'top':1, 'left':1}
Label:
id: lbl1
text: 'Vorhersage'
size_hint: .8, .1
pos_hint: {'top':1, 'center_x':.5}
Label:
id: lbl2
text: root.ids.widget1.notification
size_hint: 1, .1
pos_hint: {'bottom':1, 'center_x':.5}
WeatherWidget:
id: widget1
size_hint: 1, .8
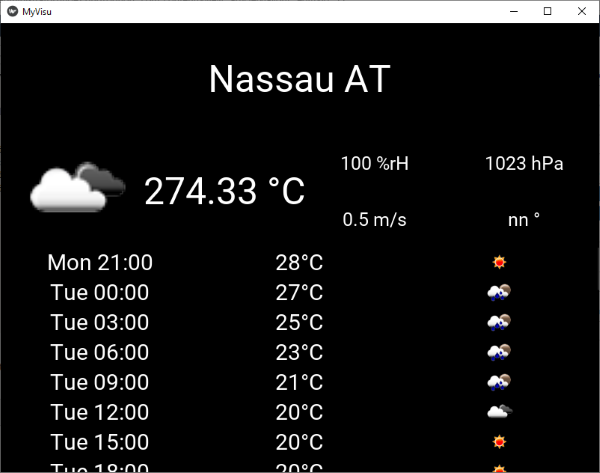
pos_hint: {'top':.9, 'left': 1}The .py file needs some attention as well. Let's add the class Scrn3. Please be careful when you set the interval for updating the weather app. OpenWeatherMap is going to block your access if you try to update in intervals shorter than 15 minutes.
class Scrn3(Screen):
    def __init__(self, **kwargs):
        '''
        Start updating the screen regularly.
        A clock will call the update function in a selectable interval.
        Put all functions you want to update into the update function
        Args:
            **kwargs (): not used. For further development.
        Returns:
            Nothing.
        '''
        super(Scrn3, self).__init__(**kwargs)
        Clock.schedule_interval(self.update, 1800)
        Clock.schedule_once(self.update)

    def update(self, dt):
        '''
        calls funtions to update the screen.
        Args:
            dt (int): interval in seconds in which the funtion will be called
        Returns:
            (float): Scaled value.
        '''
        city = App.get_running_app().config.get('Weather Widget', 'city')
        self.ids.widget1.download_current_weather(city=city)
        self.ids.widget1.download_forecast(city=city)
The result is going to look like this.
Integrate a Pollen App
And Now?
Try adding your own data and widgets or if you want to start with a little web based visualization to access your data through a browser.
Web Visu für Gebäudedaten mit Google Charts erstellen
Source Code on GitHub
The whole source code of the project and the individual widgets is on GitHub. Please comment and share if yo like it or if you want to improve it.
https://github.com/HaikoKrais/HomeDataViewer